Context
At Cisco Junior High School, teachers regularly conference with students individually to discuss academic data and set goals. Teachers review data points from NWEA MAP tests and unit tests, guiding students in understanding their strengths and growth areas. From there, teachers and students determine specific short- and long-term goals to strive for and strategies for achieving these goals. These goals are often SMART goals (Specific, Measurable, Assignable, Realistic, and Time-related).
During data conferences, teachers help guide students to ensure they understand their learning data. Some of the areas a teacher might focus on when discussing data with the student are:
- Ensuring they understand what the number means (percentage, RIT score, etc.).
- Showing them how their scores compare to national or class averages.
- Helping them identify areas where they performed well.
- Helping them identify areas where they could improve.
- Identifying areas where they are ready for new content (by showing mastery of prerequisite content).
Teachers have noticed that these data conferences have helped motivate students by improving their understanding of data beyond letter grades. This helps students make the connection between their day-to-day work and their learning data (“I want to improve X score so I need to spend more time doing Y and Z”).
Student Does
- Discusses data with teacher, and sets short- and long-term goals.
Teacher Does
- Guides students in understanding data and setting goals.
Technology Does
- Stores assessment data for each student.
Strategy Resources
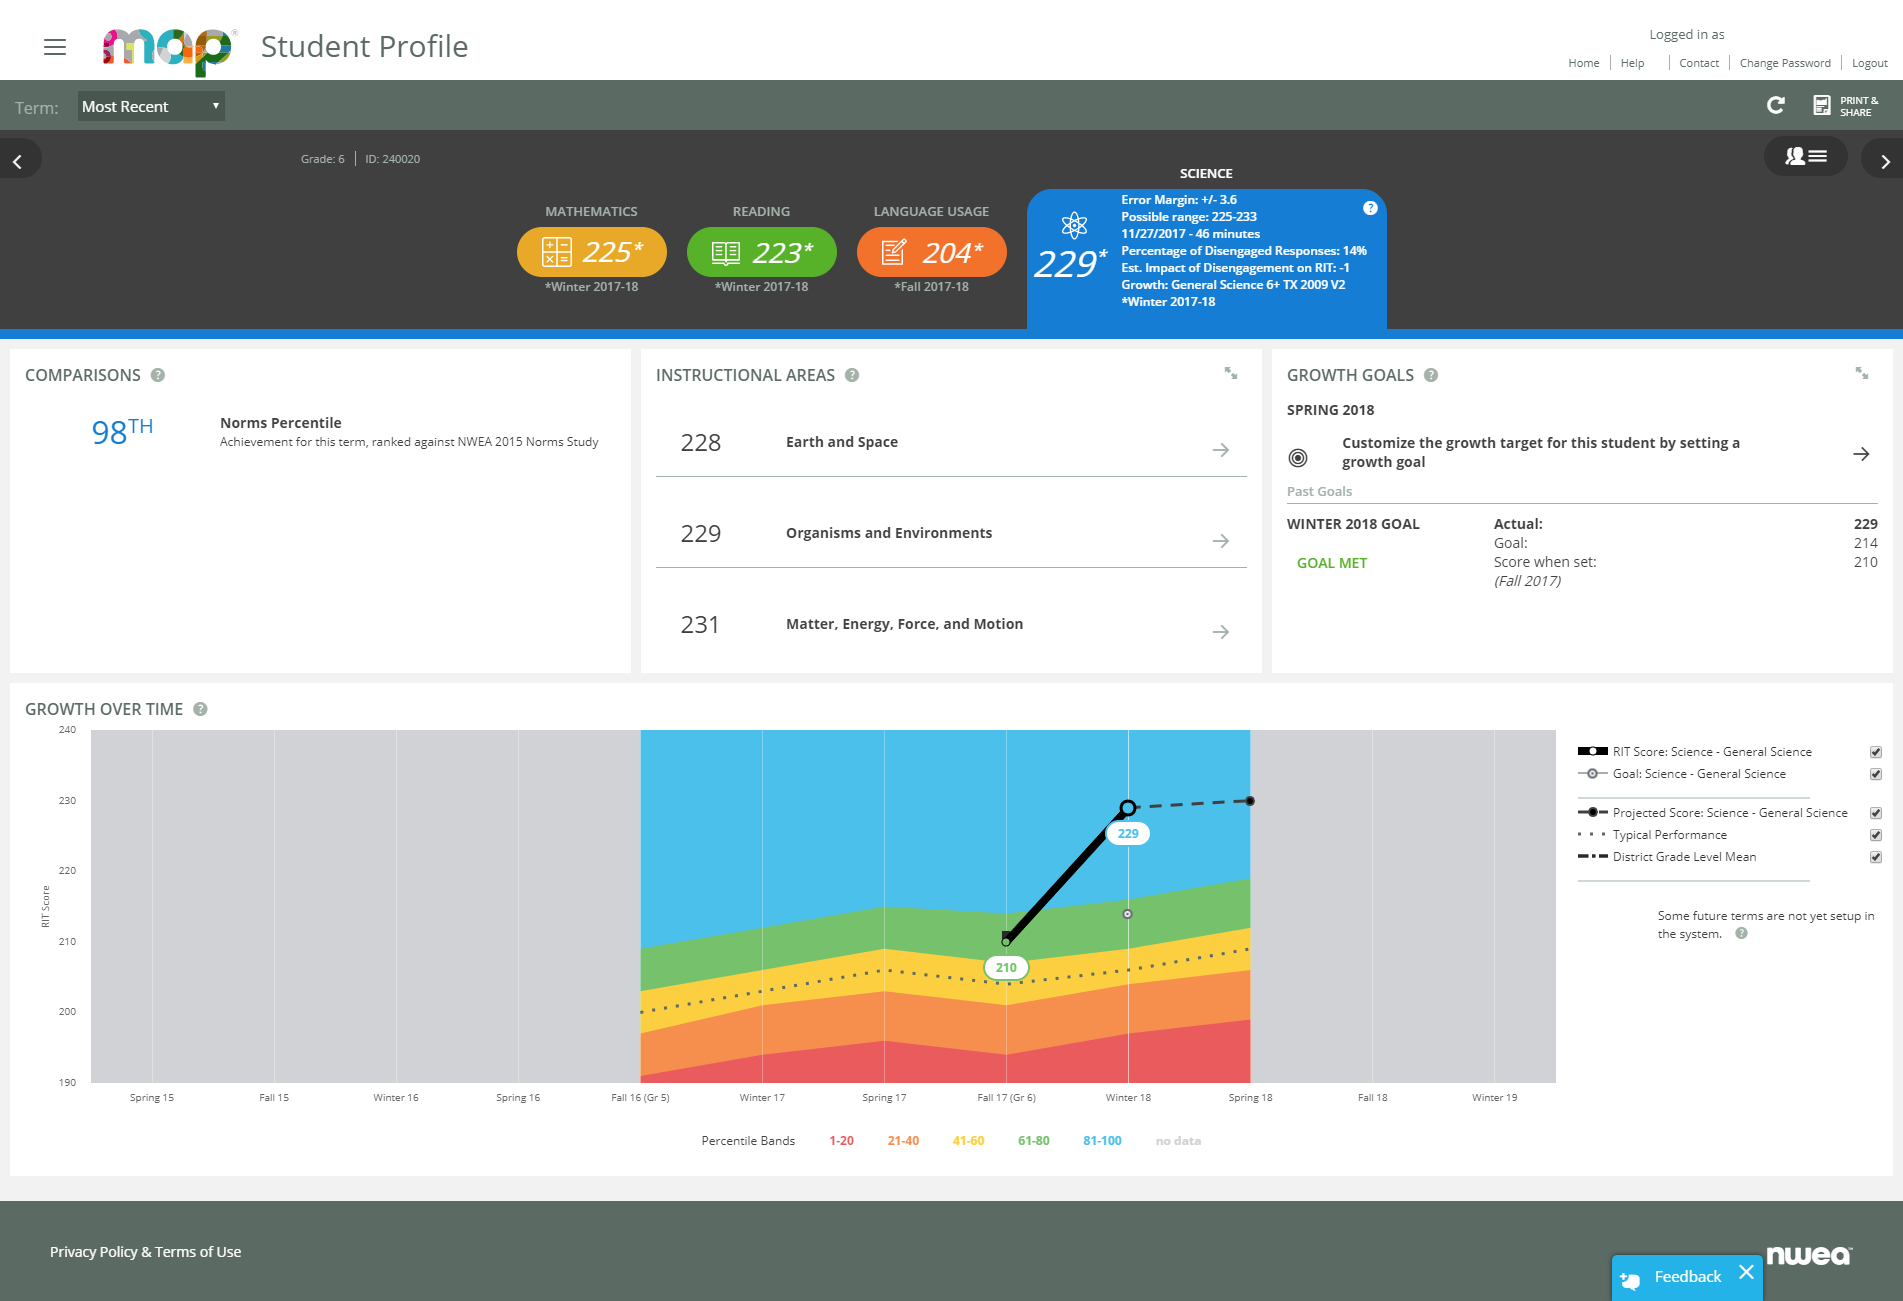
Cisco MAP Student Profile
Students and teachers at Cisco Junior High refer to the NWEA MAP student profiles to... Learn More
Using MAP Tests to Clarify Learning Needs and Goals at Cisco
Discover how MAP assessments are used at Cisco to help drive goal-setting and bring light... Learn More
Cisco Junior High School is a small district school in Cisco, TX, about two hours outside of Dallas, serving students in grades 6-8. Cisco ISD has scaled blended learning to 3rd-8th grade math and science, and is working toward scaling across the entire district. This tight-knit community-oriented district has defined four core components of the blended learning student experience and each teacher has autonomy to implement it however they think would be best for their class.
See School