Overview
Bronx Arena uses a variety of school-level metrics to help inform and improve teaching and learning. Students and teachers frequently use assessment and productivity data to monitor students’ progress and adjust supports. Educators also spend a significant amount of time on data that is typically prioritized less in traditional schools. This data helps them better identify which students may need help, as non-compliant students often make themselves known, but students who quietly struggle with their work may not be identified until much later.
Student also have access to all of this data. Full transparency allows educators and students to have open and honest conversations when attendance and/or output is trending downward. This results in more constructive conversations, instead of ones that could be perceived as accusatory, and it helps provide students with agency over their learning.
- Attendance - Students at Bronx Arena struggle with attendance, often for very valid reasons. The school monitors student attendance closely and has a variety of interventions geared toward improving attendance (e.g. text outreach, phone outreach, parent meetings, home visits).
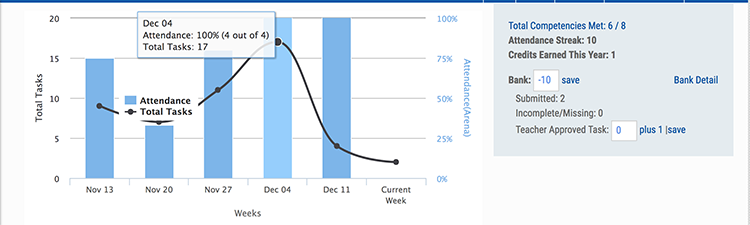
- Output - Asynchronous learning is a foundational component of Bronx Arena’s model, and school officials created structures to help students adjust to this approach. One of these structures is a productivity benchmark, emphasizing that students should complete five learning tasks per day, on average. Educators noticing a drop in a student’s productivity will check in with them, determining whether a student needs motivational or academic interventions, or are moving slower due to completing a capstone project to finish a course, among other reasons. Bronx Arena also created a positive and negative “bank,” providing some leeway for students to deviate from the daily average, as well as positive and negative interventions when certain thresholds are met. This is intended to help students get ahead and prepare for learning tasks that may take longer (e.g. capstones and essays) and provide some relief when students have days during which they are less productive than average.
- Attendance and Output - By combining Attendance and Output metrics, educators at Bronx Arena are able to have more insight into the causal factors that make students fall behind. In other schools, it is often easy to identify the students furthest behind, but not so easy to identify the reason why (without attribution error). At Bronx Arena, they are able to see how often students are coming to school and, when they’re in school, how productive they are. They are also able to view trendlines, all of which contribute to asking better clarifying questions about students’ learning experiences. For example, a student may be far behind in course content but show strong attendance and productivity for the month prior. Armed with this information, teachers could conference with the student to determine the causal factors for previously poor attendance and its recent reversal, as well as what can be done to mitigate any negative factors currently affecting the student.
Bronx Arena is an alternative high school that serves overage and under-credited students in grades 9-12 in the Bronx borough of New York City. Each student has a custom education plan meant to help them optimally learn what they need to graduate. Technology components help students move at their own pace through individualized education plans while still getting the support they need to be successful.
See School