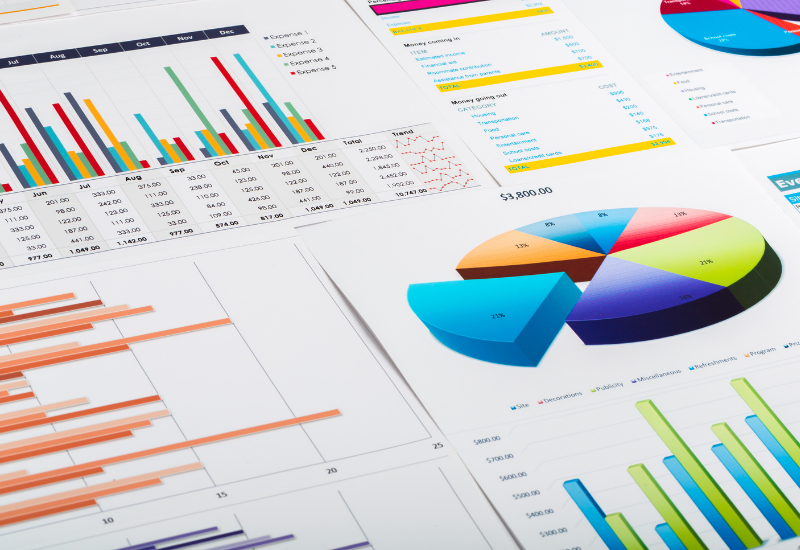
Data Visualization with Google Sheets
The Data Visualization tab within this Google Sheets workbook can be used as an example for how you might generate different types of data visualizations.
Explore More

Advocating for Students’ Unfinished Learning Needs
Collecting data to assess and monitor student learning progress can help address unfinished learning needs and advocate for needed supports.

How to Run a Focus Group
Focus groups can reveal an abundance of detailed information and insight. A well-planned focus group creates an environment for...

How to Build Accurate and Meaningful Data Visualizations
Data visualization models provide graphic representations of data, allowing you to understand and pull insights from trends, patterns, and...